The dashboard that shows whether you’re making money, job by job
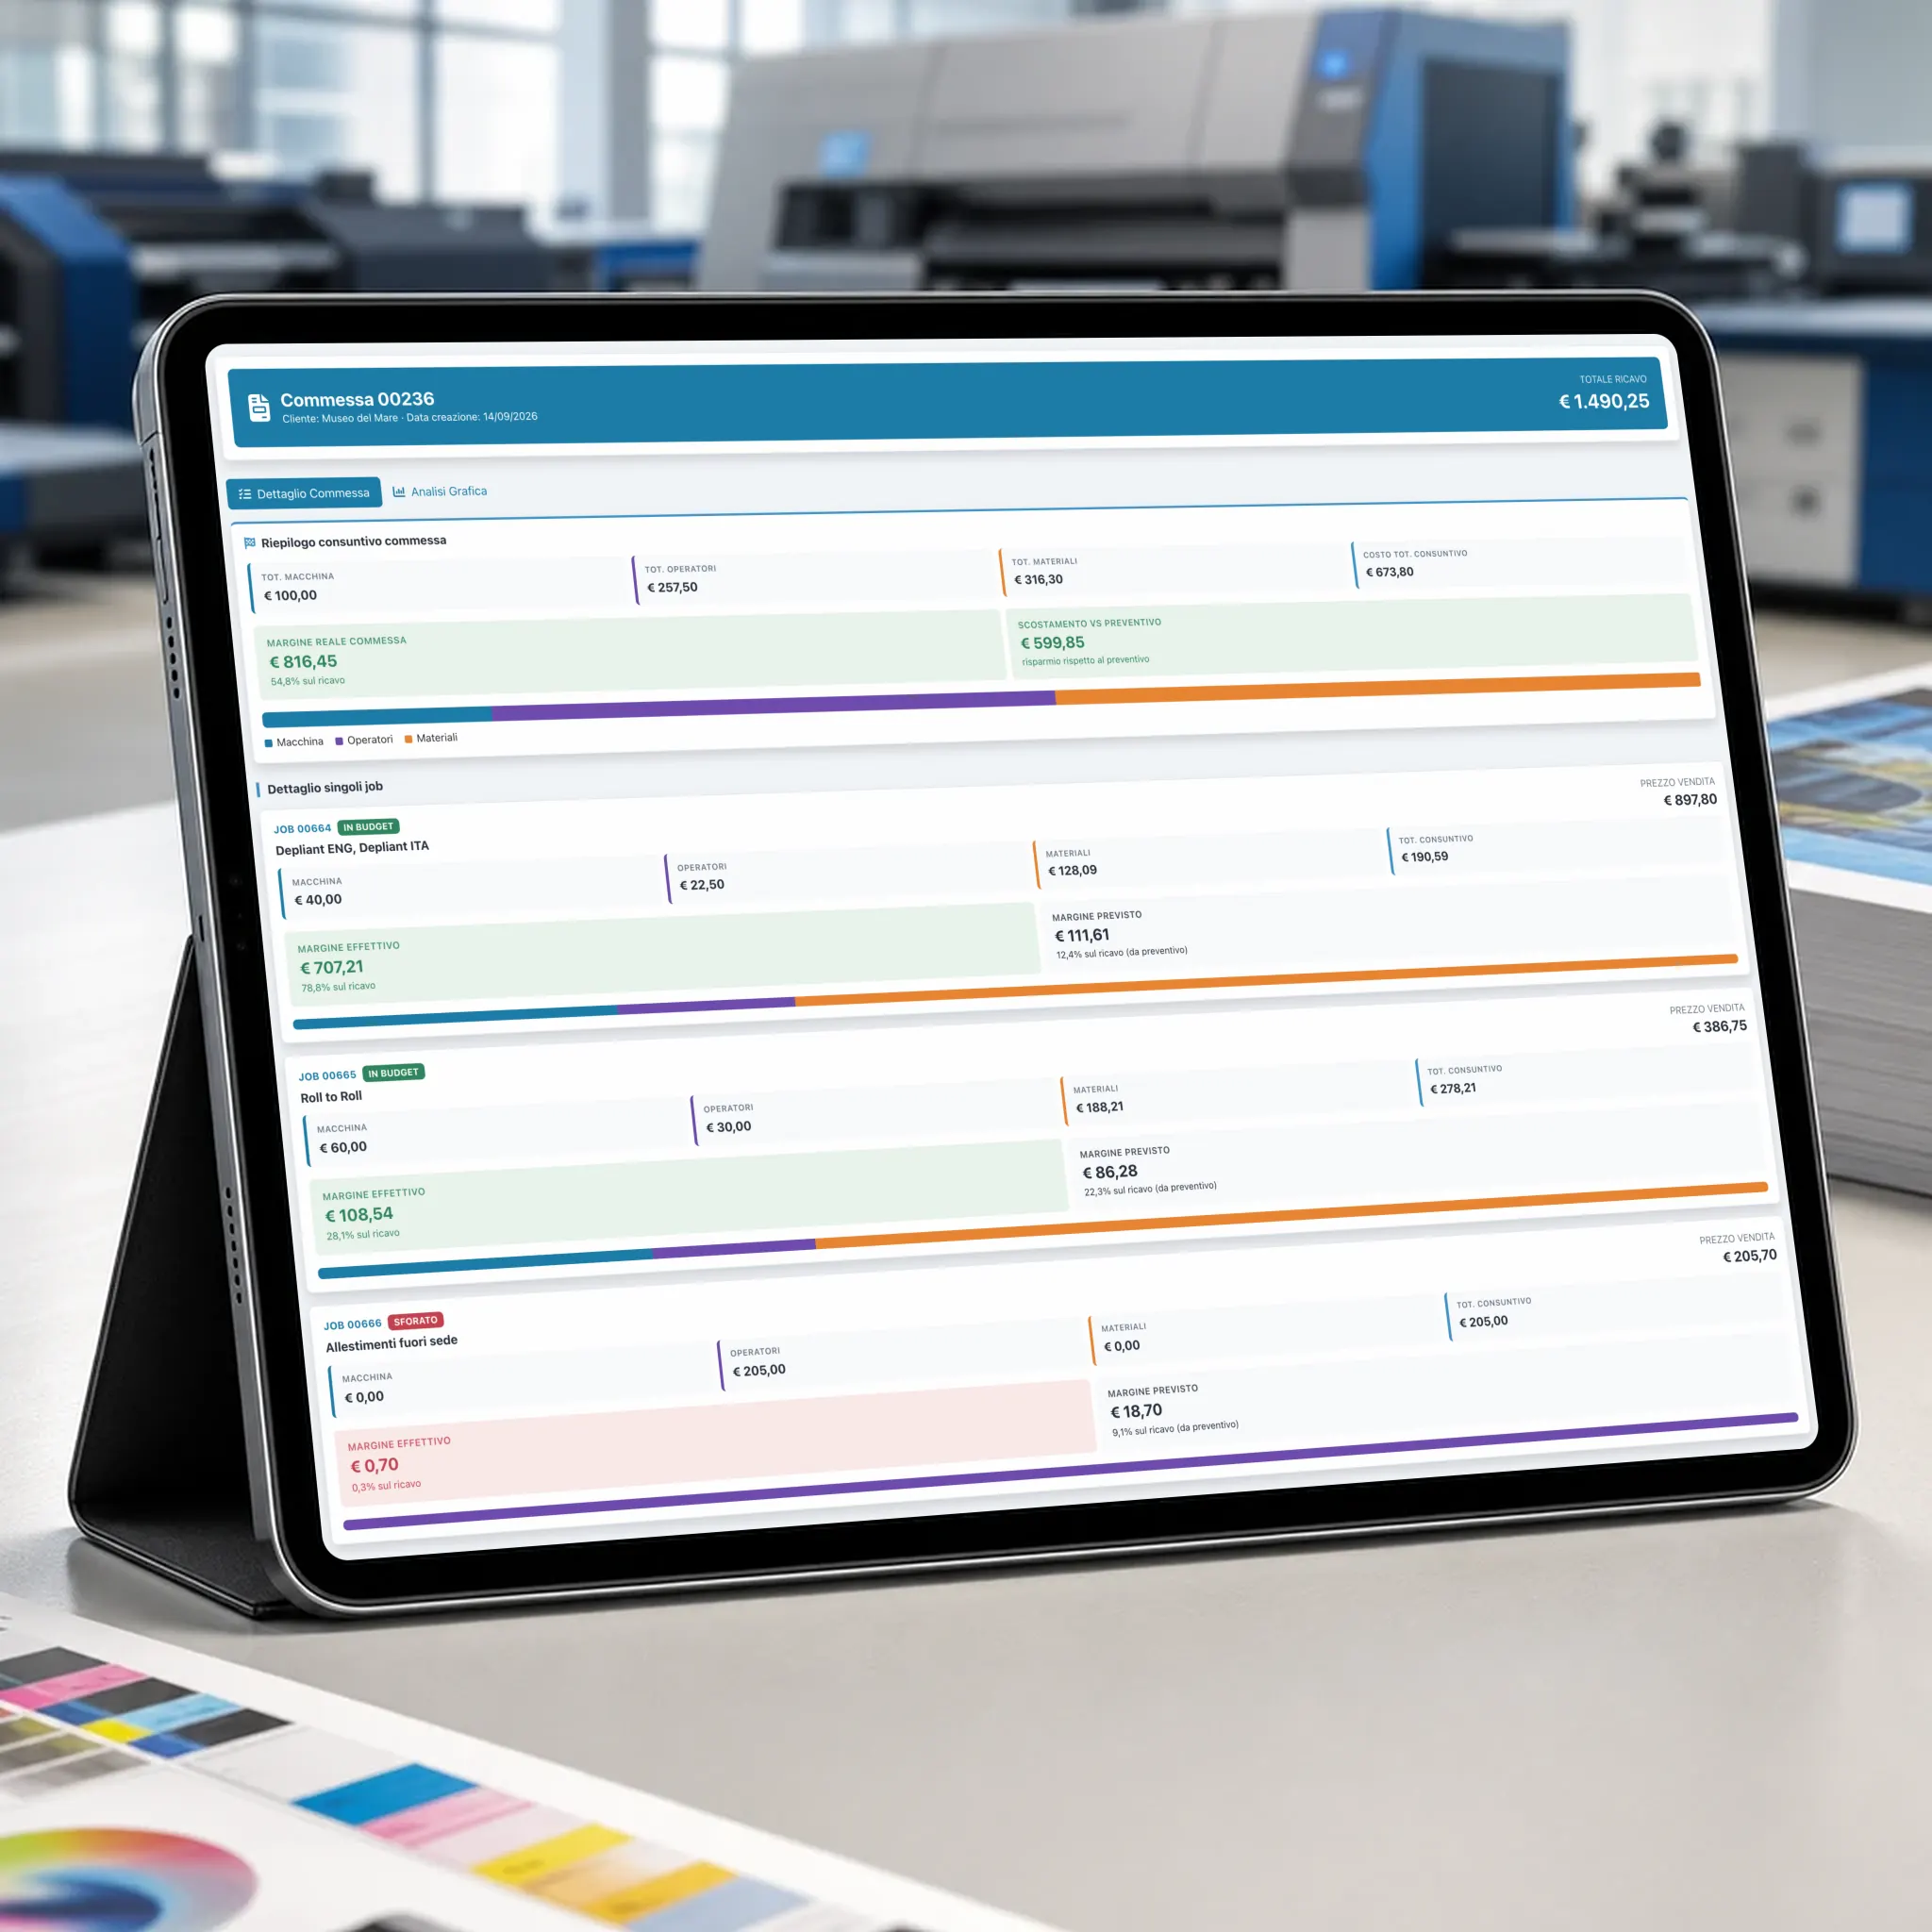
PrinTrace’s dashboard module is your print shop’s management control centre. It tracks revenue, material use, purchases and productivity, with alert thresholds you set. For every job, you compare what you quoted against what it actually cost. The data comes from the other modules — nothing to import.
Management control for print shops: four indicators and one question
PrinTrace’s company dashboard brings together four families of indicators: revenue, material use, purchases, productivity. You configure each indicator, and you decide the alert threshold. Behind the indicators is the question management control has to answer: did this job make money? The answer is in the comparison between quoted and actual, job by job. It isn’t a spreadsheet to fill in at month end. It’s the same system that produced the quote, tracked production and issued the invoice.
The problem with deciding by gut feeling
The margins don’t add up at month end
You’ve worked hard, the machines have been running, but the bank balance doesn’t show it. The accounts arrive months later and talk about last year. PrinTrace’s dashboard shows revenue, material use and purchases as they happen, not after the accounts close.
You sold that job well, but what did it actually cost you?
The quote said six hours of machine time. It took nine, plus two reprints. Without an actual-cost figure, the margin stays the one written in the quote — and it isn’t true. In PrinTrace, every job compares quoted against actual.
Materials cost more and you don’t notice
The supplier has raised the price of paper and waste has gone up. Quotes are still using last year’s costs. With alert thresholds on material use and purchases, you see it when it happens.
The PrinTrace Mini Analysis 2025, based on 30 companies, starts from here: fragmented information and time spent chasing it. Download the Mini Analysis (PDF, in Italian) →
How it works
Revenue indicators
The revenue indicator shows how much you’ve invoiced in the period and how it compares with the threshold you’ve set. The figure comes from invoices issued in accounting: updated to the last invoice, not the last set of accounts. Open the revenue report to look closer.
Material use and purchases
How much paper, toner and stock you’ve used, and how much you’ve spent buying them. The figures come from inventory: deliveries booked in, jobs booked out, waste included. You set a threshold on material use or purchases, and the dashboard flags it when you go over.
Productivity
How much work comes out of each department and in how much time. The figures come from the jobs and time sheets recorded in job management, with no separate entry. You see if a department is slowing down and whether the extra hours are really needed.
Alert thresholds you set
Every indicator has a threshold, and you decide it. Monthly revenue below a certain value, paper use above another, purchases beyond the figure you’ve fixed. When an indicator crosses the threshold, the dashboard highlights it. You don’t have to go looking for the number — the number makes itself noticed. You change the thresholds when the business changes.
Quoted versus actual, job by job
For every job, PrinTrace compares quoted against actual. On one side, the quote: hours, materials, processes, price. On the other, the actual: hours from the time sheets, materials booked out of inventory, waste, and any changes with their price adjustments. The difference tells you whether that job made what you thought. Across ten jobs of the same type, you find which process you always underestimate. Next time, the quote is right.
Reports to dig deeper
When an indicator goes past its threshold, dig deeper with the reports from each module: revenue reports, purchases and material-use reports, job and activity reporting. It’s the same data, viewed up close. No file to export and piece back together.
What changes in the business
- You decide on numbers, not on the end-of-month gut feeling.
- You know which type of job pays off and which doesn’t, job by job.
- You notice sooner when material use and purchases go past the threshold.
- Zero spreadsheets to fill in: the data is already in the system.
In 2025, average revenue for PrinTrace customers grew 10.41% compared with 2024. In the same year, over €229 million of production value passed through the system. Aggregated data from active PrinTrace customers in 2025. See all the results →
Case type B, a company with 8-15 employees. Between quotes, job tickets and invoices rewritten by hand, plus “where’s my job?” phone calls, 505 hours a year of time that doesn’t produce: around €12,617. These are hours the dashboard can’t see as long as the data sits on separate sheets. PrinTrace Mini Analysis 2025, 30 companies, conventional hourly cost of €25/h. Average figures, not a promise.
One set of data, from quote to invoice
The dashboard has no data of its own. Revenue comes from the invoices in accounting. Material use and purchases come from inventory. Productivity, time and actuals come from job management. The quoted figures come from estimating. That’s why management control in PrinTrace doesn’t ask for one extra entry. You work as usual, and the dashboard updates.
Frequently asked questions about management control
How do I know if I’m really making money on every job?
Through the comparison between quoted and actual for every job. PrinTrace puts what you estimated next to what actually happened. Hours from the time sheets, materials and waste from inventory, changes with their price adjustments. The difference tells you whether the job made what you thought. Repeated across several jobs, it shows you which processes you estimate badly.
Why don’t my margins add up at month end?
Usually because nobody records the real cost of the jobs: extra hours, reprints, waste, materials that have gone up in price. The quote stays the only figure, and the accounts arrive months later. With job actuals and the dashboard indicators, you see the gap as it forms.
Can I set the alert thresholds myself?
Yes. Every dashboard indicator is configurable, and you decide the threshold. Minimum revenue for the period, maximum use of a material, a cap on purchases. When an indicator crosses the threshold, the dashboard highlights it. You change the thresholds when the business’s goals change.
Do I have to enter data into the dashboard by hand?
No. The dashboard reads the data the other PrinTrace modules produce as you work: invoices issued, inventory deliveries and use, job times and time sheets. There’s no file to import and no sheet to fill in. If the data is in PrinTrace, the dashboard sees it.
Is management control included in the fee?
Yes. The dashboard is part of PrinTrace and has no extra cost. The subscription starts at €59 per user a month, excluding VAT. Onboarding starts at €2,540, a one-off cost.
Want to see your dashboard?
Bring us three closed jobs — one that went well and two that were so-so. In 45 minutes, online or in person, we’ll compare them in PrinTrace.
Tel. +39 06 5290689 · info@printrace.eu
DPS Soluzioni Informatiche, Viale Giorgio Ribotta 11, 00144 Rome, Italy